
Define classification
Agree on study extent, time periods, intended use, mapping scale and land-cover classes.
Satellite-based classification and change detection to understand how land is being used, how landscapes are changing and where planning responses are most needed.
Land use and land cover mapping describes the distribution of categories such as cropland, forest, built-up areas, water bodies and bare land across an area of interest. VTS selects a suitable classification system and satellite datasets to produce interpretable maps for planning and analysis.
Multi-date imagery can show where land cover has changed, provided differences in season, sensor, cloud cover and classification uncertainty are addressed.
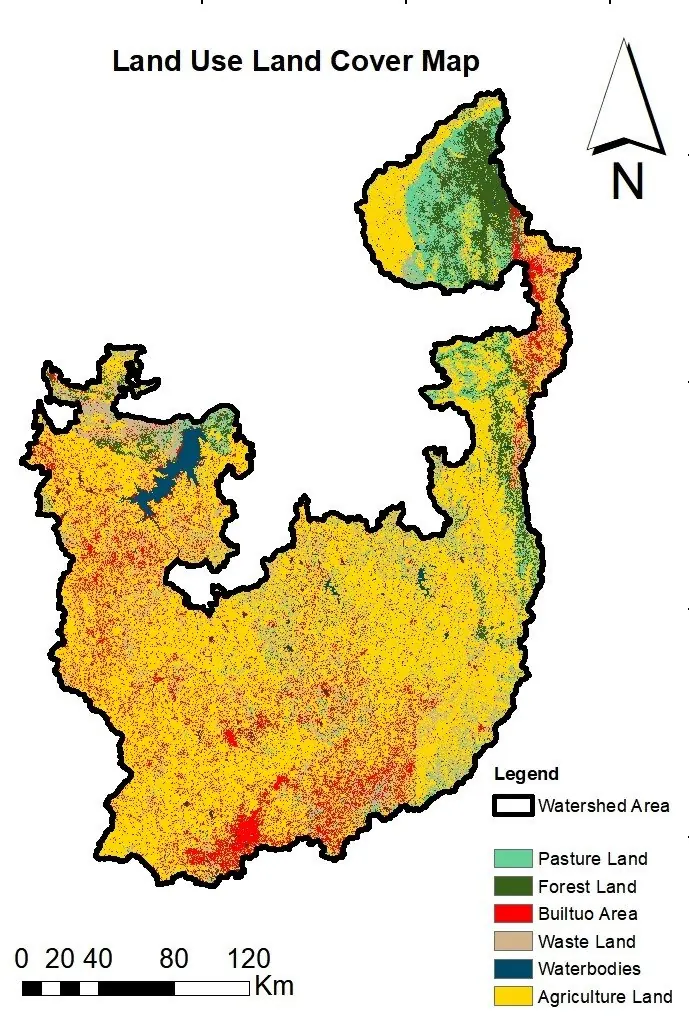
The workflow is adapted to the location, scale, source-data quality and the decisions the project must support.
Agree on study extent, time periods, intended use, mapping scale and land-cover classes.
Select suitable Sentinel, Landsat or other imagery and apply cloud and seasonal screening.
Mosaic, mask and preprocess scenes; prepare indices and supporting terrain layers as needed.
Use interpretable rules or supervised classification methods matched to available training data.
Evaluate confusion matrix and class-specific errors against independent reference samples where feasible.
Produce LULC maps, transition tables, statistics and uncertainty notes for agreed dates.
Data layers are selected for scientific relevance and reliability; requirements vary by study.
Final scope and deliverable formats are agreed at the proposal stage.
Assess land-cover context for runoff, erosion and conservation prioritisation.
Track the expansion of built-up areas and changes in surrounding land.
Map cropland distribution and landscape changes.
Document land-cover baselines and changes near sensitive areas.
Identify patterns of potential conversion for closer review.
Produce comparable land-cover datasets for time-series analysis.
A thematic map showing how an area is covered or used, using defined categories such as vegetation, agriculture, water, built-up land and bare surfaces.
Yes, where appropriate satellite data are available. Comparable dates and consistent methods help limit misleading change signals.
No. Accuracy varies with class definitions, image resolution and quality of reference data; validation and uncertainty should be documented.
Sentinel-2 and Landsat are often useful for regional mapping. The choice depends on the area, period, resolution and technical requirements.
Share the area of interest, mapping years, desired classes, area or resolution, available reference data and intended deliverables.
Explore connected geospatial services for integrated watershed, land and risk assessment.
Share your study location, area, available data and objectives. Vasu Terra Solutions will help define an appropriate assessment scope and deliverables.
Dr. Priyamvada M. Dhage — Geospatial Researcher and RS & GIS Specialist with a PhD in Soil and Water Conservation Engineering from JNKVV Jabalpur. She integrates satellite data, GIS-based resource assessment and hydrological analysis to support groundwater potential mapping, recharge-site identification and sustainable land and water management. Her training includes ISRO's Regional Remote Sensing Centre and Can Tho University, Vietnam, and she has worked on research with ISRO, ICAR and agricultural universities. She is currently a Senior Research Fellow at the College of Agriculture, Shivajinagar, Pune.
Mr. Vinod Kumar — Hydrogeologist with over 9 years of professional and research experience in groundwater assessment, hydrological studies, hydrochemical analysis and GIS-based investigations. He has worked at the National Institute of Hydrology (NIH), Roorkee, and is currently Project Scientist-II, contributing to groundwater modelling for the Chambal and Son river basins. His software expertise includes Visual MODFLOW Flex, ArcGIS, QGIS and PHREEQC.
Mr. Manas Dhage — Business Development and Client Relations. Brings over 15 years of industry experience building partnerships and driving growth for technology and infrastructure solution providers.
Last updated: 18/08/2026
This Privacy Policy ("Policy") explains how Vasu Terra Solutions ("Vasu Terra Solutions", the "Firm", "we", "us" or "our") collects, uses, stores, shares, retains and protects personal data. Under the Digital Personal Data Protection Act, 2023 ("DPDP Act") and the Digital Personal Data Protection Rules, 2025 ("DPDP Rules"), together referred to as "Applicable Law", we act as the Data Fiduciary. This Policy applies to individuals ("Data Principals", "you" or "your") who visit our website, send us an enquiry, engage our GIS, remote-sensing, environmental consulting or related professional services, or otherwise interact with us.
When you give us personal data through our website, by email, telephone, in writing or during a professional engagement, you acknowledge that you have read and understood this Policy. Where we rely on your consent, this Policy and the specific consent notice shown when your data is collected together provide the notice required under Section 5 of the DPDP Act.
Vasu Terra Solutions is the Data Fiduciary responsible for the personal data covered by this Policy. Our details are:
This Policy covers personal data relating to: (a) visitors to our website; (b) prospective clients who send enquiries; (c) clients and their authorised representatives; (d) individual vendors, consultants and professional advisers; and (e) any other individual whose personal data we handle in the course of our business. It does not cover information about a company, government body or other organisation unless that information, alone or together with other information, identifies an individual.
We may collect the following types of personal data directly from you or create them while providing our services:
We do not knowingly collect sensitive or special-category personal data beyond what is described above. A project may sometimes include personal data about other people, such as landowners named in survey records provided by a client. In that case, the client is responsible for having the legal authority to share the data with us. Clause 5 below and the indemnity provisions in our Terms and Conditions also apply.
When providing GIS, remote-sensing and environmental consulting services, clients may give us GIS files, coordinates, maps, survey records, drone or satellite imagery, and other geospatial datasets ("Geospatial Data"). Some Geospatial Data may contain personal data or may be capable of being linked to an individual, such as the coordinates of a private home or a survey record naming a landowner or occupant.
We apply the following additional safeguards to Geospatial Data:
Clients are responsible for ensuring that any Geospatial Data they provide was lawfully obtained and that they have all rights and permissions needed to share it with us, as explained further in our Terms and Conditions.
In line with Section 4 of the DPDP Act, we collect and use personal data only for the following purposes:
We will not use personal data for a purpose that is incompatible with those listed above unless we obtain fresh consent or have another valid basis under Applicable Law.
Unless Section 7 of the DPDP Act allows us to process data without consent, we rely on consent that is freely given, specific, informed, unconditional and unambiguous. You may give consent through a clear action, such as ticking a box, submitting a form or otherwise confirming your agreement. Processing without consent may include meeting a legal obligation or using information that you voluntarily provided for a specific purpose without indicating that you did not consent.
Consent statement shown beside our contact or enquiry form: "By submitting this form, you consent to Vasu Terra Solutions using the information provided to respond to your enquiry in accordance with our Privacy Policy."
You may withdraw your consent at any time, and the process should be as easy as giving consent, as required by Section 6(4) of the DPDP Act. To withdraw consent, write to our Grievance Officer using the details in clause 15. Please state that you wish to withdraw consent and identify the personal data or processing activity concerned.
Withdrawing consent does not make any earlier processing unlawful. If you withdraw consent during an ongoing project or while an invoice remains unpaid, we may be unable to continue providing services. As permitted by Section 6(6) of the DPDP Act, we may still keep and use personal data that is reasonably needed to meet existing legal obligations, including invoicing, warranty and statutory record-keeping requirements.
We do not sell personal data. We share it only with the categories of recipients listed below. Depending on the circumstances, a recipient may act as our Data Processor under a written agreement requiring it to follow our instructions and use suitable security measures, or as an independent recipient with its own lawful basis:
We do not allow these recipients to use personal data for their own marketing. Each recipient must follow confidentiality and data-protection obligations appropriate to the information it receives.
Some service providers listed in clause 9, including hosting, email, CRM and payment providers, may store or process personal data on cloud systems outside India. We transfer data only to jurisdictions that are not restricted by a Central Government notification under Section 16 of the DPDP Act at the relevant time. We also use contractual and technical safeguards consistent with Applicable Law. If the Central Government introduces restrictions for a jurisdiction, we will comply with them.
We keep personal data only for as long as reasonably needed for the purpose for which it was collected, or for as long as Applicable Law requires. Our usual retention periods are:
When the relevant retention period ends, and the data is no longer needed for its original purpose or to comply with Applicable Law, we will delete it and instruct our Data Processors to do the same. This will be done in line with Section 8(7) of the DPDP Act and Rule 8 of the DPDP Rules, including any required advance notice.
In line with Section 8(5) of the DPDP Act and Rule 6 of the DPDP Rules, we use reasonable technical and organisational safeguards to protect personal data in our possession or control. These include access controls, encryption in transit where appropriate, role-based and restricted access to Geospatial Data and client records, secure storage arrangements with hosting and cloud providers, and periodic reviews of our safeguards.
If a personal data breach occurs, we will act without undue delay to contain it and reduce its effects. We will notify the Data Protection Board of India and affected Data Principals in the manner and within the time required by Section 8(6) of the DPDP Act and the DPDP Rules. The notice will include the required information about the breach, its likely impact, and the steps taken or planned to reduce risk.
Subject to the conditions and exceptions in the DPDP Act, you have the following rights:
To exercise any of these rights, write to our Grievance Officer using the details in clause 15. We will respond within the time required by Applicable Law and may ask for reasonable information to confirm your identity before acting on your request.
Our website and services are intended for businesses, professionals and organisations, not for anyone under eighteen (18) years of age (a "Child" under the DPDP Act). We do not knowingly collect personal data from Children. If we learn that we collected a Child's personal data without verifiable consent from a parent or lawful guardian, we will delete it promptly unless Applicable Law allows us to retain it.
As required by Section 13 of the DPDP Act, we have appointed the following Grievance Officer to handle questions, requests and concerns about this Policy and our use of personal data:
We will acknowledge and respond to grievances within the time required by the DPDP Rules. If you are not satisfied with our response, you may escalate the matter to the Data Protection Board of India in the manner prescribed by the Board.
Our website currently uses only technologies that are strictly necessary for it to work, such as session handling for form submissions. We do not currently use non-essential cookies, third-party analytics, tracking pixels or advertising technologies, so we do not display a cookie-consent banner. If we introduce any of these technologies later, we will update this section and add a consent banner or similar tool that allows you to accept or reject non-essential cookies before they are used, as required by Applicable Law.
We do not sell, rent or trade personal data for money or any other benefit.
We may update this Policy when our practices, services or Applicable Law change. The "Last updated" date at the top shows when the Policy was most recently revised. We will publish material changes on our website with a new date. If a change significantly affects how we use personal data, we will also provide an additional notice, such as by email, where practical. Continuing to use our website or services after the notice means that you acknowledge the updated Policy.
This Policy is governed by Indian law, including the Digital Personal Data Protection Act, 2023, the Digital Personal Data Protection Rules, 2025 and, where applicable, the Information Technology Act, 2000 and the rules made under it.
If you have questions about this Policy or how we handle personal data, contact us using the business email and address in clause 2, or write to the Grievance Officer using the details in clause 15.
Last updated: 18-08-2026
These Terms and Conditions ("Terms") explain the rules for using the Vasu Terra Solutions website (the "Website") and for engaging our geographic information system (GIS), remote-sensing, environmental consulting and related professional services (the "Services"). The Services are provided by Insert Legal Name of Proprietor/Entity, trading as "Vasu Terra Solutions" ("Vasu Terra Solutions", the "Firm", "we", "us" or "our"). Anyone who engages our Services is referred to as the "Client", "you" or "your".
By using the Website, sending us an enquiry, accepting a proposal or quotation, or otherwise engaging our Services, you agree to these Terms and our Privacy Policy. If you do not agree, please do not use the Website or engage our Services. A signed engagement letter, statement of work or project-specific agreement (an "Engagement Agreement") may add to or change these Terms. If there is a conflict, the Engagement Agreement will take priority.
You may use the Website only for lawful purposes and in line with these Terms. You must not, and must not help anyone else to:
If we reasonably believe that someone has breached this clause, we may restrict, suspend or end their access to the Website. We may also pursue any legal remedies available to us, including an injunction, where Website content has been scraped or reused without permission.
An enquiry does not create a binding engagement. After receiving an enquiry, we may send a written proposal or quotation describing the scope, deliverables, fees, timeline and key assumptions (the "Proposal"). An engagement becomes binding only when the Client accepts the Proposal in writing, including by email, or signs an Engagement Agreement, as applicable. A Proposal remains valid for the period stated in it. If no period is stated, it remains valid for thirty (30) days from its issue date.
The fees for the Services will be stated in the relevant Proposal or Engagement Agreement. Unless expressly stated otherwise, fees do not include applicable taxes, including Goods and Services Tax (GST). The Client must pay all applicable taxes at the rate in force on the invoice date, in addition to the stated fees.
Unless we agree otherwise in writing, payments are due according to the milestones stated in the Proposal or Engagement Agreement, such as an advance or mobilisation payment, interim milestone payments and final payment on delivery. Invoices must be paid within 10 days from the invoice date, unless the invoice or Engagement Agreement states a different period.
Overdue amounts will carry interest at 18% per annum or the highest rate allowed by law, whichever is lower, from the due date until payment is received. If payment remains outstanding for 15 days after the due date, we may suspend work, withhold deliverables or end the engagement, without affecting any other rights or remedies available to us.
Either party may end an ongoing engagement by giving 7 days' written notice. The Client must still pay for all work completed, expenses incurred and non-cancellable third-party commitments, including data licences, up to the termination date. Payments for completed work and for third-party data, licences or resources already purchased for the Client are non-refundable. If the Client cancels an accepted Proposal before work begins, we may charge 12% to cover administrative and planning costs already incurred.
We may end an engagement immediately by written notice if the Client fails to pay an amount when due, provides materially inaccurate project data, breaches these Terms, or acts unlawfully or fraudulently, or in a way that exposes the Firm to legal or regulatory risk.
The Client must provide complete, accurate and timely information and materials reasonably needed for the Services, including data, GIS files, coordinates, maps, survey records, site access and approvals ("Client Data"). The Client confirms that it has all rights, licences and permissions needed to share the Client Data with us and allow us to use it for the engagement. We are not responsible for delays, errors or deficiencies in the deliverables caused by Client Data that is incomplete, inaccurate, outdated or unlawfully obtained.
Any timeline in a Proposal or Engagement Agreement is an estimate. Delivery may depend on matters outside our control, including the timely receipt of Client Data and approvals, satellite revisit frequency, the availability of cloud-free imagery, weather, field-access permissions, ground-truthing requirements, and the Client's timely review and approval at each stage. If we expect a material delay, we will inform the Client and provide a revised timeline as soon as reasonably practical. We are not liable for delays caused by these factors.
Unless the Proposal or Engagement Agreement states otherwise, the Client may request 3 rounds of revisions, provided the revisions stay within the agreed scope. Additional revisions, or changes to the scope, methodology, data sources, area of interest or deliverable format, will be treated as a change order. We will quote and charge for that work separately, and will begin only after both parties agree to it in writing.
The Client must review the final deliverables and report any deficiency in writing within 10 business days after delivery. If we do not receive such notice within that period, the deliverables will be treated as accepted. We will correct deficiencies within the agreed scope at no additional charge. A request caused by a later change in scope, requirements or Client Data will be handled as a change order under clause 8.
Once all fees have been paid, the Client will own the final deliverables created specifically for the engagement, including project-specific reports, maps and datasets, for the purpose for which they were commissioned. We continue to own our pre-existing or independently developed methodologies, models, algorithms, scripts, code, templates, tools and know-how, together with any improvements or derivatives, even if they are used or developed during the engagement. Where any of these materials are embedded in a deliverable, the Client receives a non-exclusive, non-transferable licence to use them only for its own internal use in connection with the project. They may not be resold, sublicensed or used for competing engagements unless we agree otherwise in writing.
Our deliverables may use or be derived from third-party geospatial data, including Sentinel and Landsat imagery, data processed through Google Earth Engine, and other open or licensed datasets ("Third-Party Data"). The use of Third-Party Data and any related deliverable remain subject to the original provider's licence terms, attribution requirements and restrictions, such as the Copernicus/Sentinel Data Terms, the USGS/Landsat data policy and the Google Earth Engine Terms of Service. We cannot give the Client rights beyond those granted by the original provider. The Client is responsible for ensuring that its intended use complies with all applicable third-party terms.
Each party must protect any non-public information received from the other in connection with an engagement, including Client Data, project locations, deliverables, pricing and business information ("Confidential Information"). Confidential Information may be shared only with employees, sub-consultants or professional advisers who need it and are bound by equivalent confidentiality duties; with the disclosing party's prior written consent; or when required by Applicable Law, a court order or a regulatory authority. This duty continues for 2 years after the engagement ends. Confidentiality obligations relating to sensitive Client Data or project locations continue indefinitely.
The Client understands that Indian law restricts the survey, mapping, collection and sharing of certain geospatial data, including information about defence installations, critical infrastructure, border areas and other regulated categories. These restrictions include the National Geospatial Policy, 2022, and related guidance from the Department of Science and Technology and other competent authorities. We will not survey, process or share regulated geospatial data unless all required approvals and legal requirements are met. The Client must not ask us to act otherwise and must tell us promptly if a project involves, or may reasonably involve, regulated geospatial data.
Remote-sensing and GIS analysis has inherent limitations. Results may be affected by sensor resolution, cloud or atmospheric interference, gaps between satellite passes, modelling or classification uncertainty, and the accuracy of reference and ground-truth data. Desk-based and remote-sensing deliverables do not replace field investigation, ground surveys or physical verification. They should be verified in the field before being used for decisions with significant financial, safety, legal or regulatory consequences.
We provide our analysis, modelling and advice with reasonable skill and care. However, we cannot guarantee the presence, quantity or quality of groundwater or any other natural resource; the approval of any licence, environmental clearance or permission by an authority; or the commercial, financial or investment result of a project or decision based on our deliverables. These outcomes depend on matters outside our control, including natural conditions, regulatory decisions and market conditions.
The Client is responsible for all final engineering, legal, construction, land-acquisition, investment and regulatory-compliance decisions made using our deliverables. Before acting, the Client must obtain independent advice from suitably licensed engineers, architects, advocates, statutory auditors or other professionals where appropriate. Our deliverables support decision-making; they are not engineering designs, legal advice or a replacement for any statutory certification required from a licensed professional.
Important Disclaimer
Our geospatial analyses and suitability assessments support decision-making. They are based on the data, methods, resolution and assumptions described in the relevant project report. They do not replace field investigation, statutory approval, engineering design or advice from a licensed professional where required.
Except where these Terms or an Engagement Agreement expressly state otherwise, the Services and deliverables are provided on an "as is" basis. To the fullest extent allowed by Applicable Law, we exclude all express and implied warranties, including warranties of merchantability, fitness for a particular purpose and non-infringement.
To the fullest extent allowed by Applicable Law: (a) our total liability arising from an engagement, whether in contract, tort (including negligence), statute or otherwise, will not exceed the fees actually paid by the Client for the specific Services that gave rise to the claim; and (b) we will not be liable for indirect, incidental, consequential, special or punitive losses, or for loss of profit, revenue, business, data or goodwill, even if we were told that such loss was possible. Nothing in these Terms excludes or limits liability where the law does not allow it, including liability for death or personal injury caused by negligence, or for fraud.
The Client will indemnify and protect us against claims, losses, liabilities, damages, costs and reasonable legal fees arising from: (a) Client Data or Third-Party Data selected or supplied by the Client that is inaccurate, unlawfully obtained, unlicensed or provided in breach of another person's rights; (b) the Client's use of deliverables in breach of these Terms, an Engagement Agreement or applicable Third-Party Data licence terms; or (c) the Client's breach of clause 13 on Regulated and Sensitive Geospatial Data.
Neither party is responsible for a failure or delay caused by events beyond its reasonable control. These may include natural disasters, pandemics, war, civil unrest, government action, satellite or data-provider outages, internet or telecommunications failures, or a third party's refusal of field access (a "Force Majeure Event"). The affected party must notify the other promptly and resume performance as soon as reasonably practical. If the event continues for more than 60 days, either party may end the affected engagement by written notice. The Client must still pay for work completed up to the termination date.
These Terms and any dispute connected with them, including a non-contractual dispute, are governed by the laws of India. The parties will first try to resolve the dispute through good-faith negotiation within 60 days after written notice. If they cannot resolve it, the dispute will be finally settled by arbitration under the Arbitration and Conciliation Act, 1996. The arbitration will be seated in Mumbai, Maharashtra, conducted in English, and heard by one arbitrator jointly appointed by the parties. Subject to the arbitration requirement, the courts at Mumbai, Maharashtra, will have exclusive jurisdiction over matters that cannot be referred to arbitration and supervisory jurisdiction over the arbitration.
We may update these Terms from time to time. The "Last updated" date shows when the current version took effect. Updated Terms apply once they are posted on the Website and will govern engagements entered into after that date. An engagement already in progress will continue under the Terms that applied when the relevant Proposal was accepted, unless the parties agree otherwise in writing.
If a court or arbitral tribunal finds any part of these Terms invalid, illegal or unenforceable, that part will be removed and the rest of the Terms will remain in effect.
A party does not waive a right by delaying or failing to exercise it. Exercising a right once, or only in part, does not prevent that party from exercising it again or using any other right.
The Client may not assign, transfer or subcontract its rights or obligations under these Terms without our prior written consent. We may assign or subcontract some or all of our rights or obligations to an affiliate, successor or sub-consultant involved in delivering the Services, provided that any sub-consultant is bound by confidentiality obligations at least as protective as these Terms.
These Terms, the applicable Proposal or Engagement Agreement, and our Privacy Policy form the entire agreement between the parties on their subject matter. They replace all earlier oral or written discussions, representations and agreements, except in the case of fraudulent misrepresentation.
If you have any questions about these Terms, please contact us using the details below:
Last updated: 18/08/2026